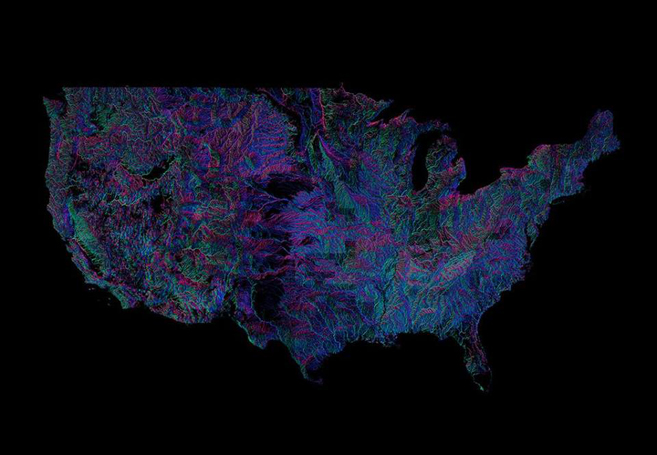
Infographic artist Andrew Hill of Vizzuality built this fascinating interactive map of all 250,000 rivers in the United States. Built with the CartoDB platform, with data from the National Hydrography Dataset (via the US Geological Survey), Hill created this stunning interactive map which features 3 colors representing each river’s direction. For example, tue pink shows rivers running north-south or south-north. Blues, greens, and reds also reveal other directions, and it’s all yours to explore above. For more amazing infographics be sure to visit Infographics on FEELguide.
Stunning Interactive Map Reveals Directions Of All 250,000 Rivers In The United States
Brent Lambert
Writer, editor, and founder of FEELguide. I have written over 5,000 articles covering many topics including: travel, design, movies, music, politics, psychology, neuroscience, business, religion and spirituality, philosophy, pop culture, the universe, and so much more. I also work as an illustrator and set designer in the movie industry, and you can see all of my drawings at http://www.unifiedfeel.com.


