


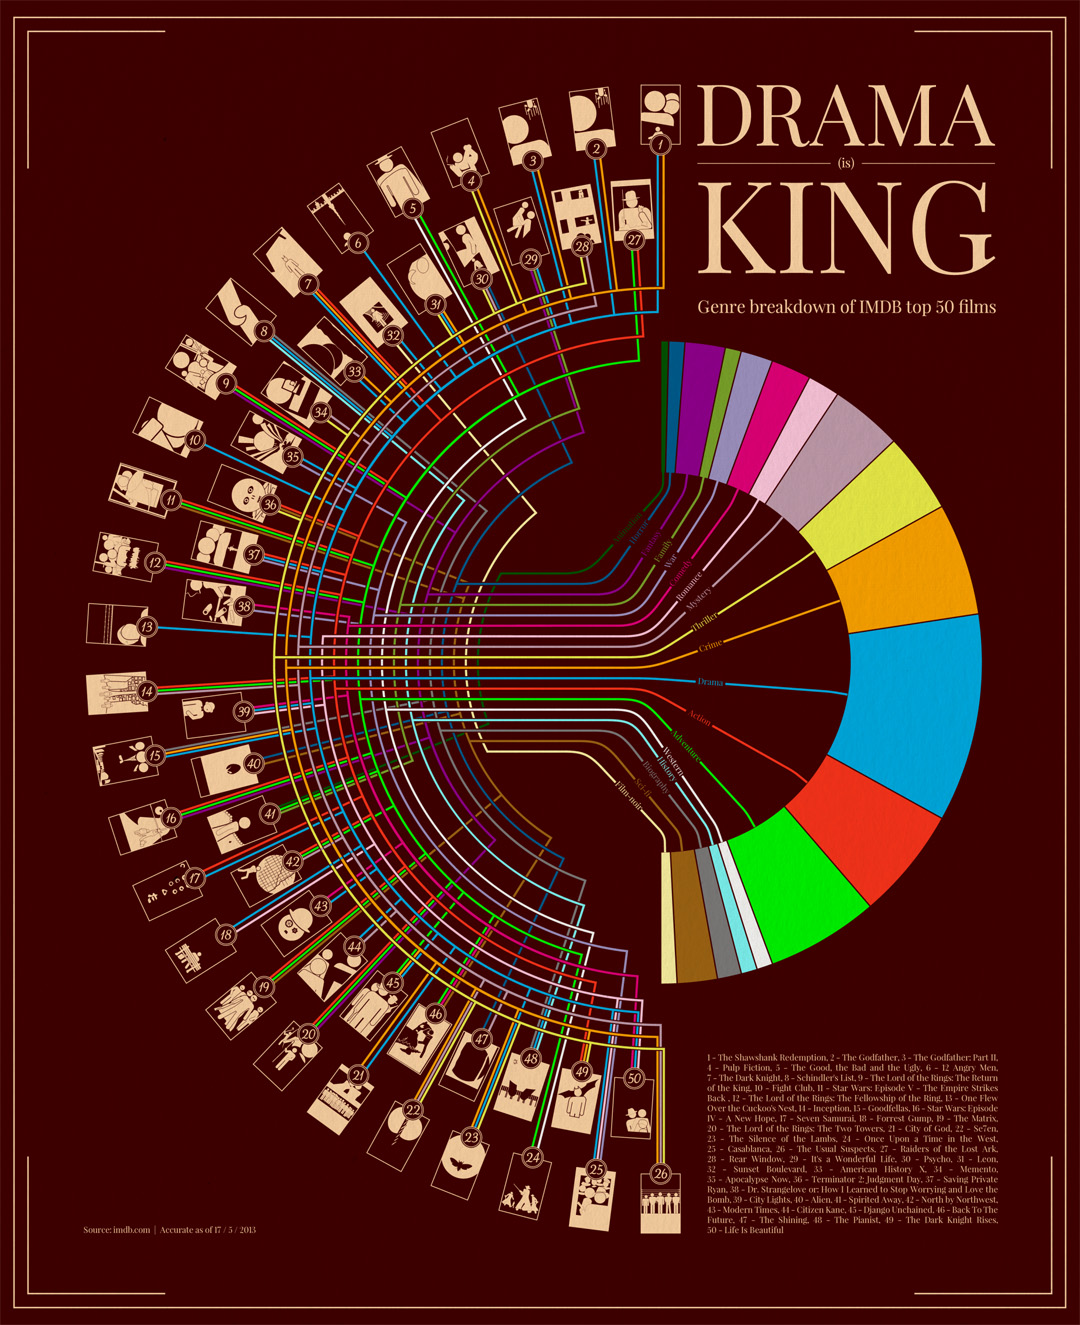
IMDb, otherwise known as the Internet Movie Database, is one of those websites that frequently astounds me. Launched on October 17, 1990 by British film fan and professional computer programmer Col Needham, the site has grown into a behemoth with over 100 million unique users each month and a solid and rapidly growing mobile presence. I’ve worked in the film industry for more than 10 years now and IMDb is an invaluable tool and resource, and its data set is so enormous that infographic artists are able to turn this epic mountain of data into stunning graphic breakdowns of various topics. Take for instance this awesome new infographic designed by Martin Kruusimagi below. Popular Science writes: “Kruusimagi color-coded the top 50 IMDb movies by genre: dramas are organized and counted with blue, while sci-fi gets brown. The colors then snake across the map until they reach the relevant movies, so a line of pink (comedy) reaches an illustration representing No. 43, Chaplin’s ‘Modern Times’. Multiple genres can be assigned to each movie, so ‘Times’ also gets a light blue line for drama.” As one might expect, drama is king — and Martin Kruusimagi, I might add, deserves a crown of his own as well. NOTE: CLICK ON IMAGE BELOW TO ENLARGE. FOR A HIGHER RESOLUTION VERSION CLICK HERE.
SEE ALSO: Watch The 50 Greatest Steadicam Shots In Movie History In This Terrific Homage
SEE ALSO: Banner Photo #116: “Razzle Dazzle” Explores Hollywood’s Craftsmanship Of Celebrity, Fame & Success


